2023 Year in Data - Time Tracking
Motivation
As part of my “Year in Data” effort, I visualized and analyzed the 2066 hours of focused time, mostly spent at my computer. This includes 3 classes at Georgia Tech and 21 projects in my role at the Tennessee Valley Authority as well as “intentional overhead” which doesn’t quite fall into other buckets. It includes time spent developing web apps and time teaching classes. It includes time spent watching lectures and taking exams. I’ve spent (wasted?) yet more time this year compiling a fairly comprehensive picture of all this, so the logical question is… why?
First of all, why did I collect all this data? I have some productivity geek tendencies and heard people discuss time tracking for some time on various podcasts. This year, I also started a Master’s program and wanted a tool to understand how much time I was spending at my computer. Throughout the year, I used this data to stop myself from working nonstop and to keep myself honest when I was feeling lazy.
So, great, but why did I create this document itself? Well, the data is only as good as what you do with it, right? I assure you this isn’t an exercise in vanity or toxic productivity. It’s an analysis that intrigued me and a process I thought might be interesting to others.
You won’t find time spent checking email, getting coffee between meetings, or lying on the beach in Mexico discussed here. You will find a discussion of every focused minute of my academic, professional, and computer geek life.
Data Collection
I used a service called Toggl and an iOS app called Timery to collect and observe this data. Toggl serves as the back end where the data gets recorded. Timery is a great app that sits on top of Toggl’s API to provide easy-to-use widgets and visualizations. You can create saved timers and select from recent timers, reducing the friction of tracking yourself all the time.
Total Time and Statistics
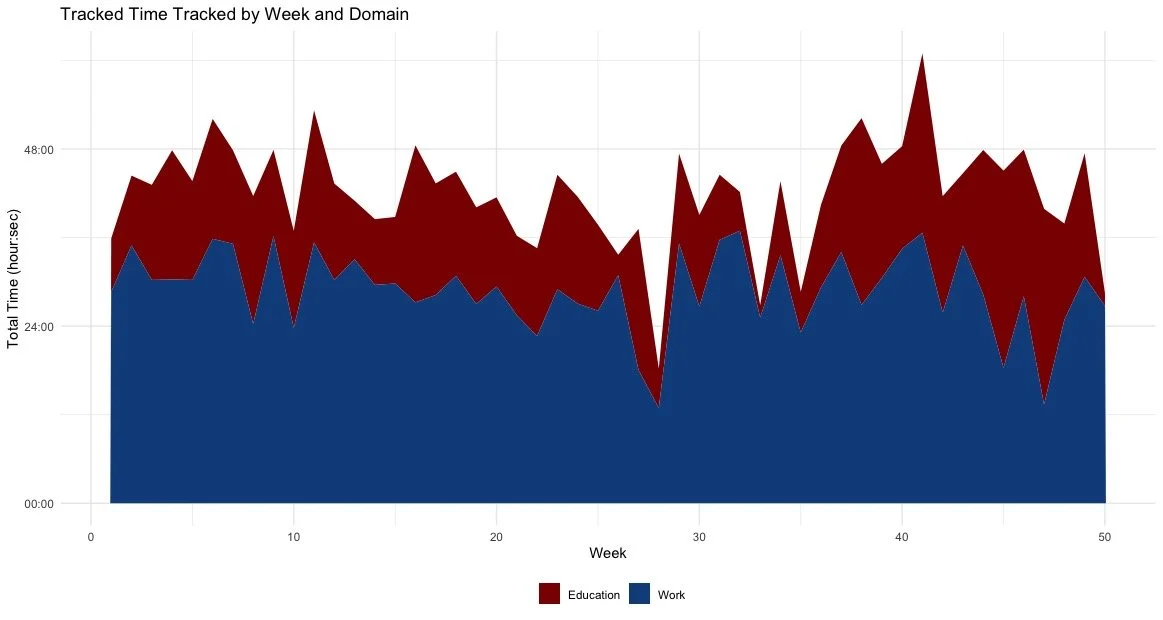
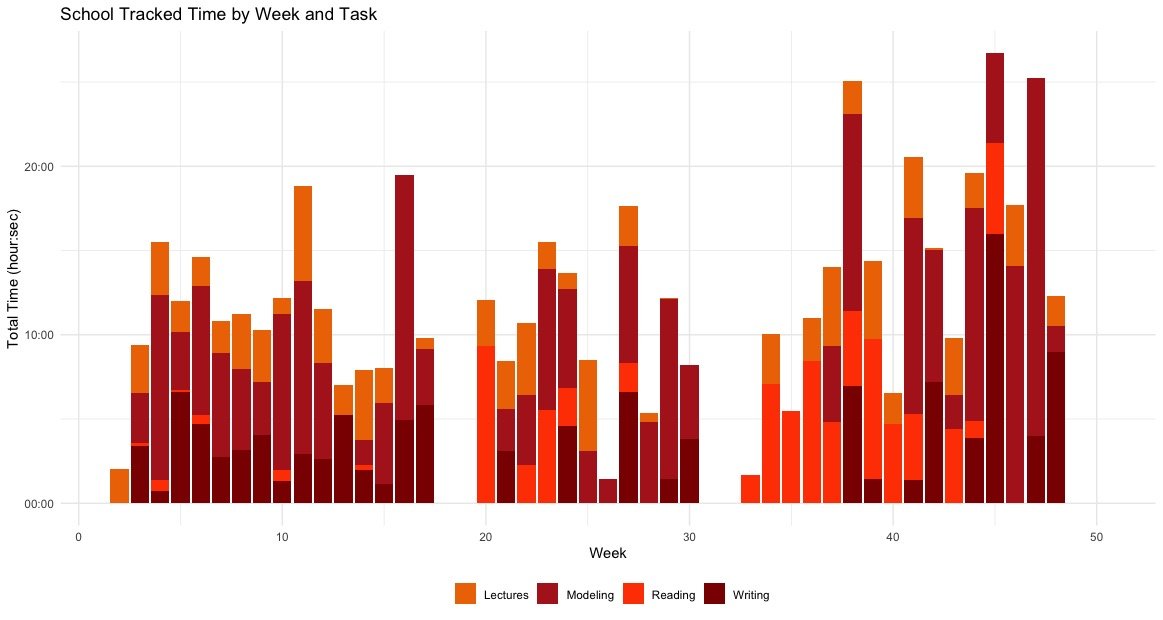
I worked much more in the second half of the year due to an increase in time spent on school, which weighed on me. I wouldn’t want to ever be much busier than that and will be looking for ways to streamline studying in future semesters. There were a couple of weeks in the summer where I took vacations, but I may try to take smaller breaks more often to preserve my sanity.
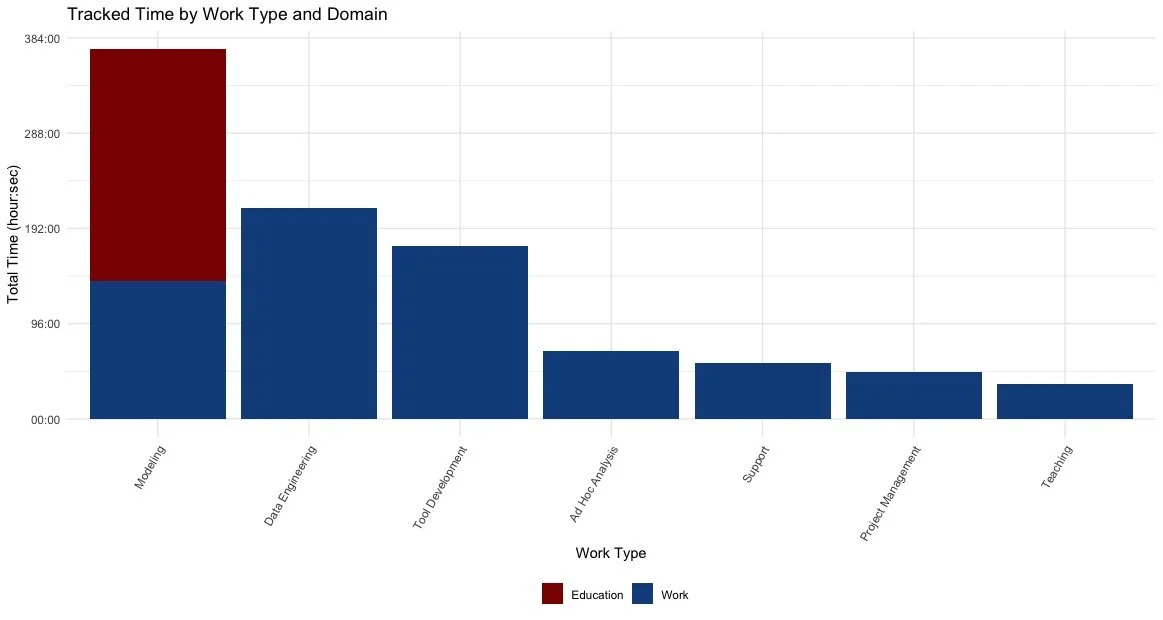
Out of my main technical skills, I did more modeling (machine learning) work than anything else. However, most of my modeling time came from my graduate courses. I build an AI agent that could solve Raven’s Progressive Matrices, ran experiments to evaluate automated trading algorithms, and modeled smoking status as a function of other health factors At TVA, I spent more time doing data engineering tasks. These included designing the PEA database and ETLs, working in the Customer Analytics pipeline, and the EnergyRight database redesign. I also spent more time developing tools, including Impacts Forecasting App improvements and the DER Porfolio Evaluation App redesign. These types of work also came in at second and third overall.
I’ll also share some more restful statistics. I took 48 days away from my desk completely and averaged 6.75 hours focused working time on days that I did work. I switched focus or took a break an average of 7 times each working day. December isn’t quite complete yet, so these numbers will likely go up around the holidays.
Work
On the average work day, I logged 6.4 hours of focused time for work across 8 separate time entries. This doesn’t include time spent checking email, responding to messages on Teams, or planning for the week ahead. It only includes time spent working on a dedicated project.
I usually work on 4 projects per day. 2023-09-07 was my most “unfocused” day, on which I somehow worked on 9 projects. On the bright side, I did have 19 ‘single-focus’ days this year. These 19 days include conferences, all-hands events, planning sessions, and weekend days where I only put in a few hours total.
The type of work I did shifted over the year. The beginning of the calendar year and the end of the fiscal year involved more tool development time, mostly related to a major redesign of one of our internal web apps in January and the subsequent feature additions. Data engineering work was highest through the spring and into the summer, mostly driven by required testing and debugging of new Databricks Long-Term Support versions in our AMI data pipeline and the design of a new database for energy efficiency program evaluation data. The increase in fall modeling work resulted from a strong push to clean up existing measure-level EE and BE load shapes as well as the ad hoc analysis around CWHPs.
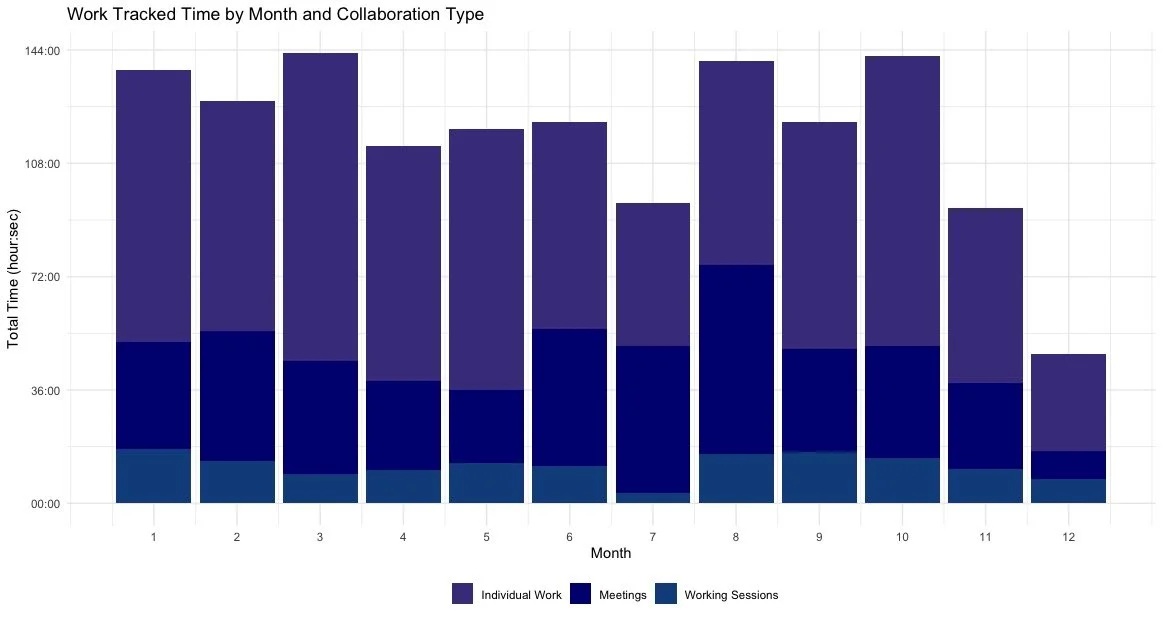
With all these open projects, my team and I are consistently struggling with the “right” amount of time to spend collaborating and working individually. This year, I spent 30% of my time in meetings and 10% in working sessions, leaving 60% of my focused time for individual work. This was fairly consistent throughout the year, but August brought significantly more meetings and working sessions as I took on collaboration opportunities and core work increased for several projects simultaneously.
Education
This year, I started my Master’s of Computer Science with a Specialization in Machine Learning at Georgia Tech. While it’s been really interesting, it’s also been exhausting. In addition to the work day, I spent an average of 2 hours working on school 2 to 3 days a week. I worked both weekend days about 37%2 of the time for an average of 4.6 hours each day. My longest school day included 10.2 hours of focused time, which was a weekend day this fall.
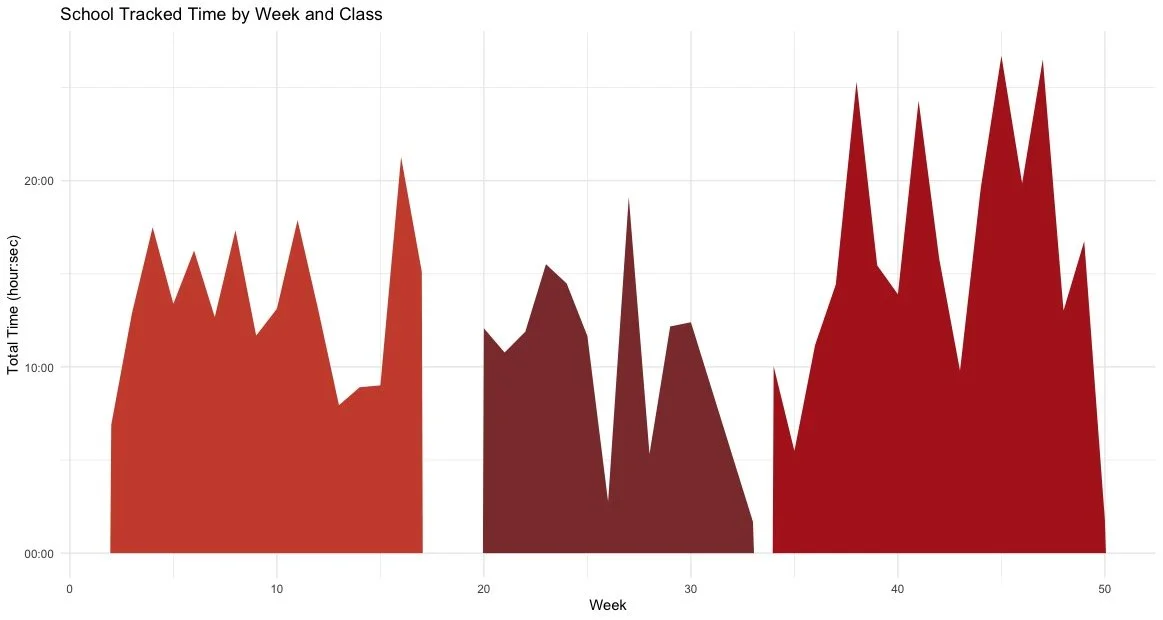
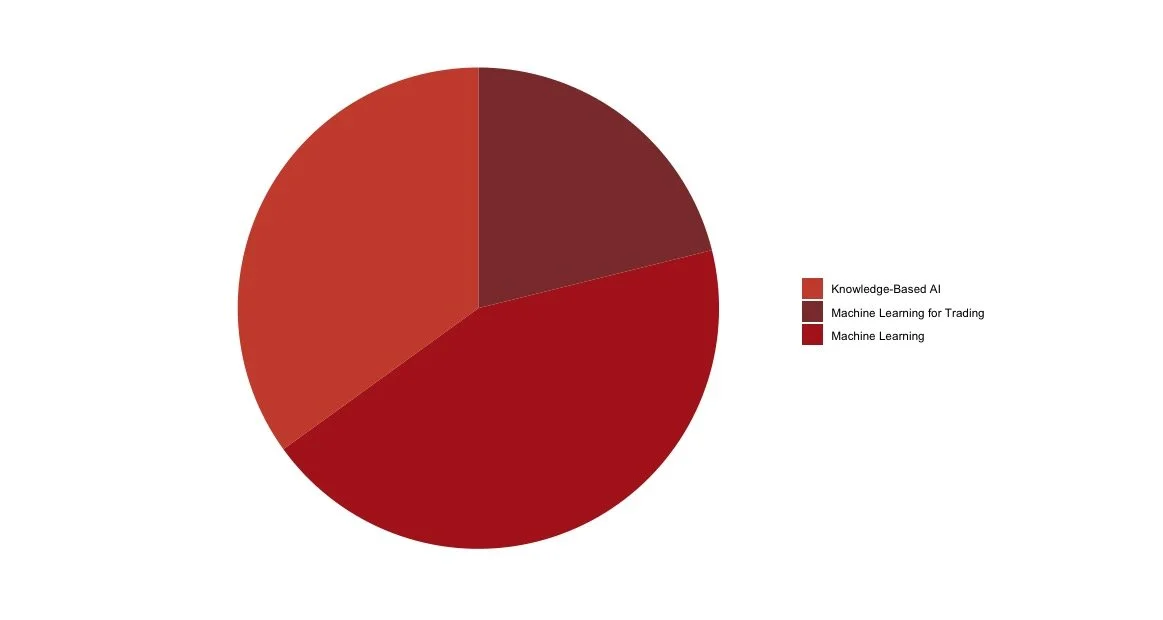
The fall semester has required more time than Spring or Summer because I took Machine Learning, which has a reputation for being difficult. I spent progressively more time on each project because I wasn’t getting the grades I hoped for, from 27 hours for the first project to 52 hours for the fourth and final project.
Conversely, Machine Learning for Trading is known to be a much easier course, which made it a good choice for the condensed summer semester. The projects had clearer report rubrics and emphasized performance components - meeting efficiency and accuracy requirements. It was easy to tell when I was done; in Machine Learning, I always felt there was more I could do right up to the due date.
Knowledge-Based AI had a very consistent pace throughout most of the semester. After the last lectures, I focused solely on the main project of the course: creating an AI agent to solve Raven’s Progressive Matrices. I took time off from work in the last week to focus on this, driving up my time spent in the last few weeks.
Machine Learning also involved more reading than the other classes I took. Knowledge-Based AI had particularly little reading because the lectures were the main medium. I spent more time writing and modeling most weeks. Knowledge-Based AI required a consistent mix of each type of work throughout the semester, whereas Machine Learning was more self-directed. I attempted to front-load a lot of the readings and lectures so that I could spend more time on the projects later in the semester. This wasn’t very successful because I used all of that buffer in the first project and then felt like I was playing catch-up most of the time after. This was exacerbated by several due dates that were extended with only a few hours notice, resulting in unwarranted rushing and a condensed timeline for the project that followed.
Conclusion
This has been a very interesting experiment, and I plan to do it again next year. Much of the value I get from tracking my time isn’t even in this bulky review. I have a much better understanding of when I burn out, not just over a semester but day-to-day. Some days it’s tempting to put in a twelve-hour day just to inflate the numbers or to feel accomplished in some weird way. But it doesn’t work out in the end because the next day I inevitably log much less focused time. In this way, I’ve learned valuable information about how to structure my school work to best fit into other parts of my life.
It’s good to see that I do spend most of my TVA time on individual work, even when it feels like there are too many meetings to keep track of. I’ll be curious to see how my work time continues to change as my responsibilities in the CES EAG grow and we emphasize different projects within our team. Maybe the distribution of “clients” will be more even in the new year as we focus more on O&R and P&C needs. There’s lots to look forward to.
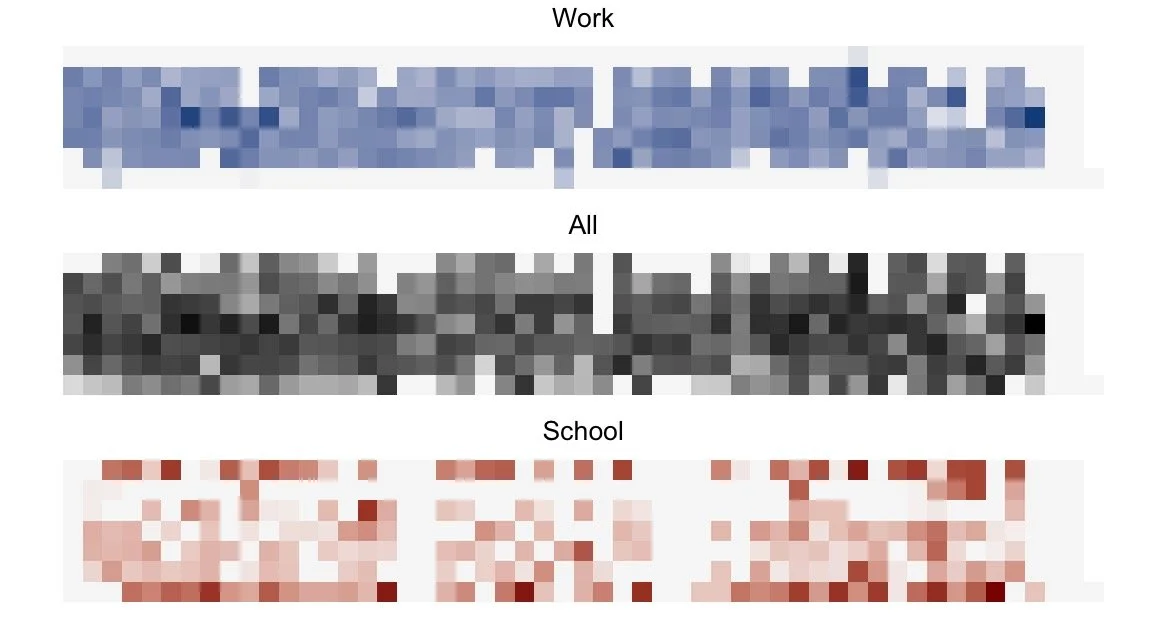
To conclude, I’ll leave you with my favorite of these charts.
